A/B Testing
A/B testing lets you compare two sorting strategies on the same collection and decide which one performs better based on real shopper behavior — not a hunch. You can pit one recipe against another, or test whether Dynasort’s sorting beats your store’s default order.
How it works
Section titled “How it works”Instead of splitting visitors into two groups, Dynasort alternates the whole collection between the two variants on a fixed schedule. Every shopper who visits the collection during a given window sees the same sort order; when the toggle interval elapses, the next window flips to the other variant.
This is called strict alternation. It avoids the cookie and personalization complexity of per-visitor splits, and it works cleanly inside Shopify without modifying your storefront code.
Setting up a test
Section titled “Setting up a test”Open the collection you want to test and click Set Up A/B Test in the sidebar.
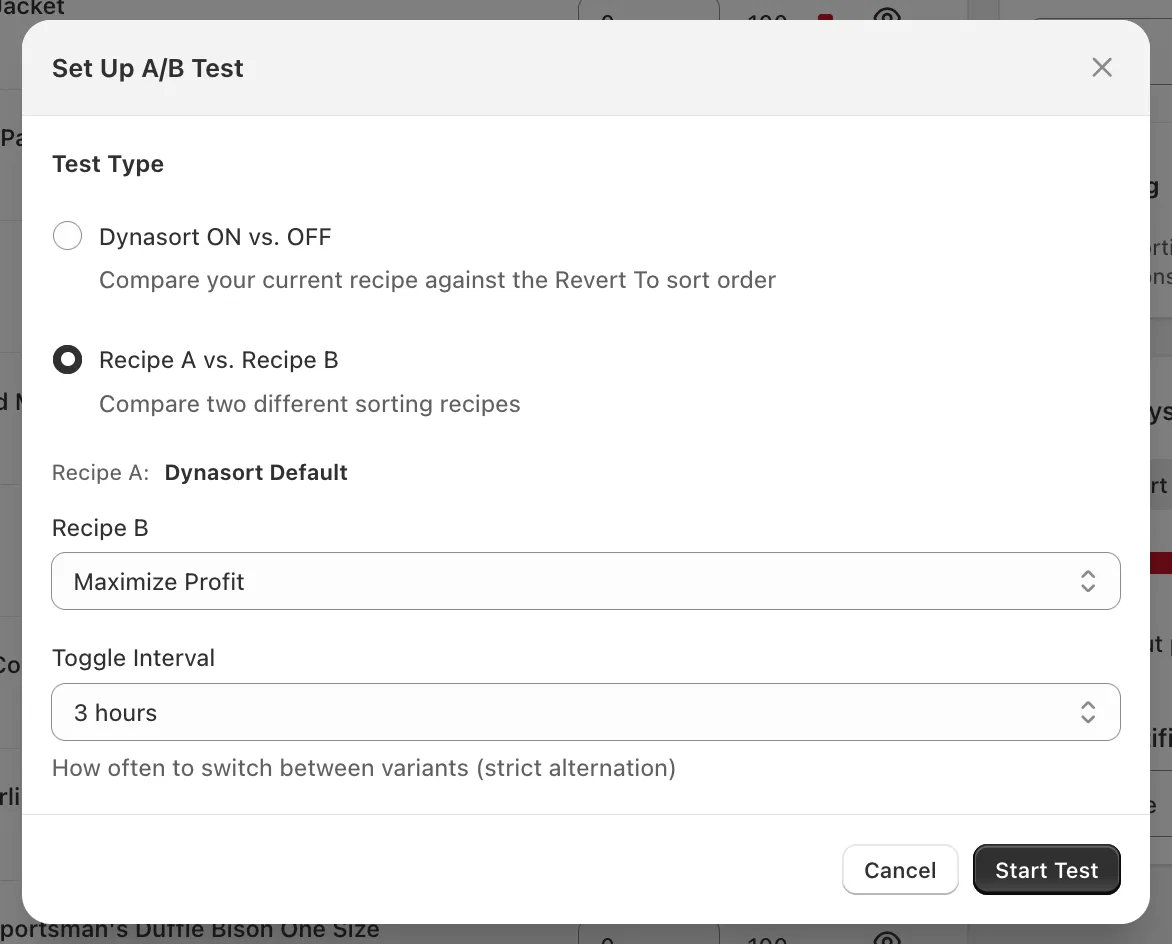
Choose a Test Type:
- Dynasort ON vs. OFF — Compares your currently-applied recipe against the collection’s Revert To sort order (typically your store’s default like Best Selling, Manual, or Created Date). Use this to prove Dynasort is moving the needle versus doing nothing.
- Recipe A vs. Recipe B — Compares two Dynasort recipes against each other. Recipe A is whatever is currently applied to the collection. Pick Recipe B from the dropdown.
Set the Toggle Interval — how often the active variant flips. Available options range from 1 hour to 1 week. Common choices:
- 1–3 hours for high-traffic collections, so you cycle through enough windows quickly.
- 6–12 hours for medium traffic, to capture morning, afternoon, and evening shopper segments evenly.
- 24–48 hours for low-traffic collections, to make sure each window accumulates a meaningful number of sessions before flipping.
- 72 hours or 1 week for very low-traffic collections where daily variance would otherwise swamp the signal.
Click Start Test. The test begins immediately on the next page-load.
Monitoring an active test
Section titled “Monitoring an active test”Once a test is running, the collection’s sidebar shows a live A/B card:
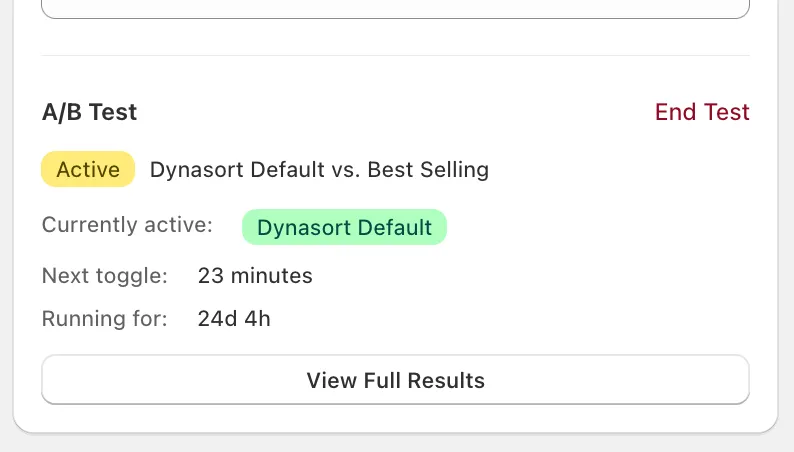
The card shows you:
- Active badge and the variant pair being compared.
- Currently active — which variant shoppers are seeing right now.
- Next toggle — countdown to the next variant flip.
- Running for — total elapsed test duration.
- End Test — stop the test and lock in whatever data has been collected.
- View Full Results — open the metrics detail (see below).
You can also see all active and completed tests at a glance from the Collections page using the new A/B Testing filter tab:
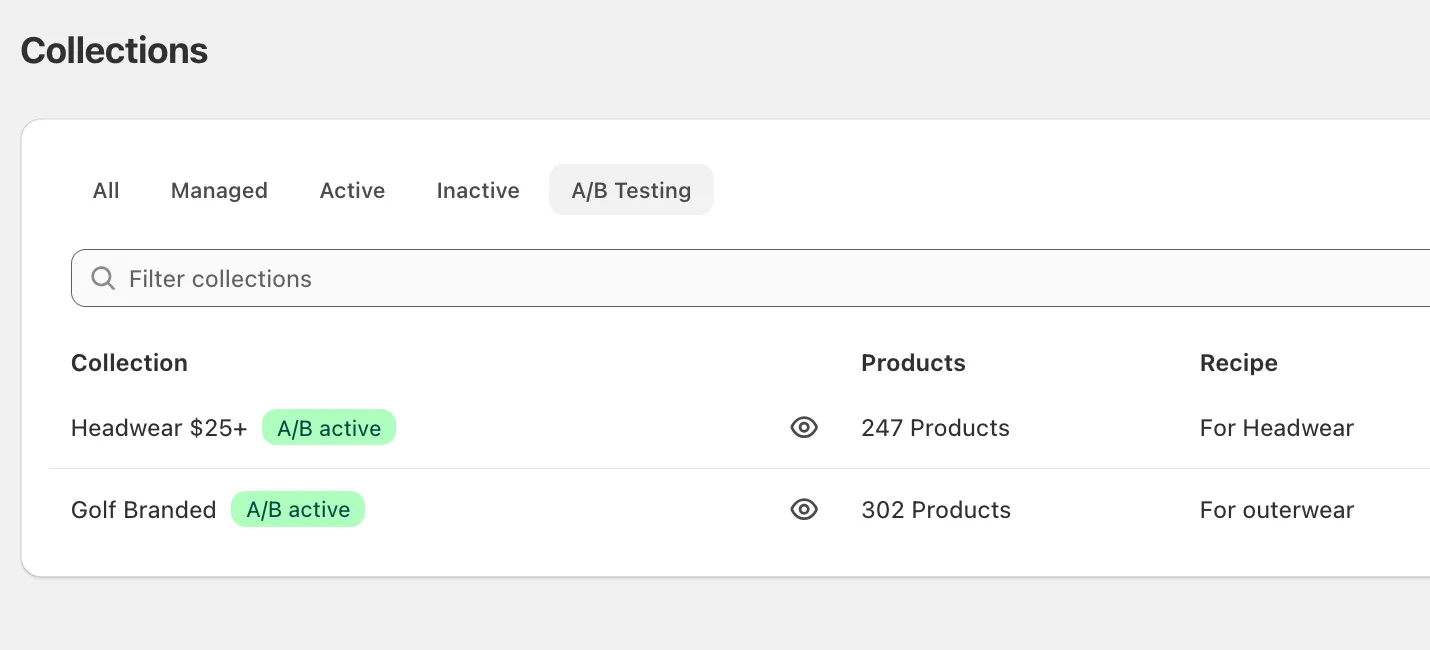
Collections currently running a test display a green A/B active badge. Collections with completed tests display a grey A/B results badge, so you can come back to old results any time.
Changing the recipe during a test
Section titled “Changing the recipe during a test”If you try to change the active recipe on a collection while a test is running, Dynasort will warn you and ask to confirm:
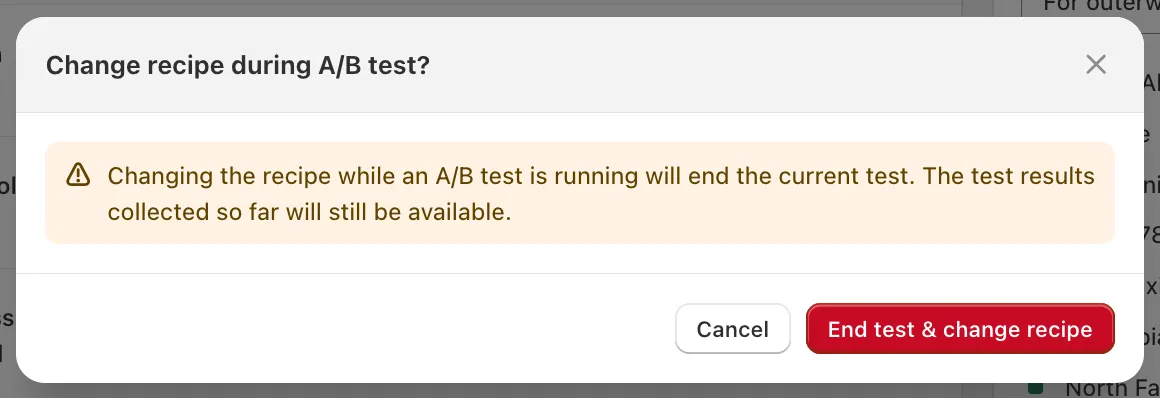
The test will end, but all results collected so far remain available — they just stop accumulating. This guardrail exists because changing the underlying recipe mid-test would invalidate the comparison.
Reading results
Section titled “Reading results”Click View Full Results to open the metrics detail.
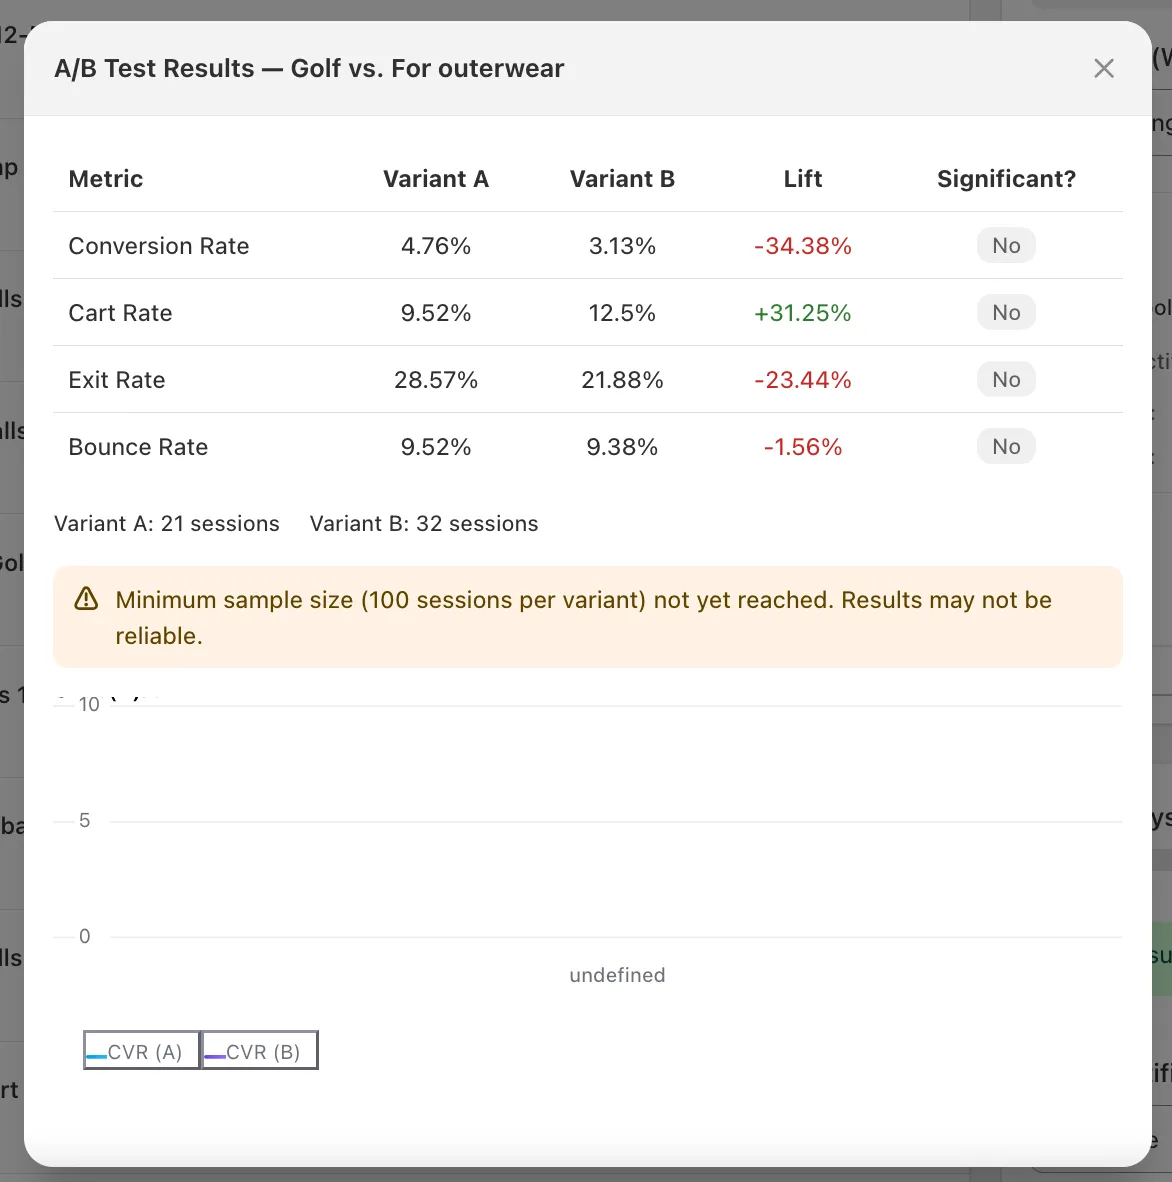
The table compares the two variants across four metrics:
| Metric | What it measures |
|---|---|
| Conversion Rate | % of sessions that resulted in a completed order |
| Cart Rate | % of sessions that added at least one product to cart |
| Exit Rate | % of sessions that left the site after viewing this collection |
| Bounce Rate | % of sessions that landed on this collection and left without other actions |
Each metric shows:
- Variant A and Variant B values.
- Lift — the percentage change of Variant B relative to Variant A. Green means B did better, red means A did better. (For Exit Rate and Bounce Rate, lower is better, so negative lift on those is good.)
- Significant? — whether the observed difference is statistically meaningful. See below.
Beneath the table you’ll see total session counts for each variant, and below that, a chart of conversion rate over time for both variants.
Statistical methodology
Section titled “Statistical methodology”Dynasort uses a two-proportion z-test with pooled variance and a two-tailed p-value. In plain English:
- For each metric, we count the number of sessions in each variant and the number that “converted” on that metric (e.g. completed an order, for Conversion Rate).
- We compute the rate for each variant, plus a pooled rate from the combined data, and use the pooled rate to estimate the standard error of the difference.
- From the standard error and the observed difference we get a z-score, then a two-tailed p-value.
- Significant? = Yes when p < 0.05 — i.e. there is less than a 5% chance the observed difference happened by chance if the two variants were actually equivalent.
This is the standard approach used by most commercial A/B testing tools (Optimizely, VWO, Shopify’s own conversion testing, etc.), so the numbers should match what you’re used to seeing elsewhere.
Why the 100-session minimum?
Section titled “Why the 100-session minimum?”The z-test is only reliable when both variants have enough observations for the underlying normal approximation to hold. Below ~100 sessions per variant, even large-looking lifts (±30%) routinely come from random noise. Dynasort hides the conclusion until the threshold is crossed so you don’t act on a phantom result.
What about confidence intervals or Bayesian methods?
Section titled “What about confidence intervals or Bayesian methods?”The current results display p-values only. We’re tracking interest in adding confidence intervals and a Bayesian “probability B beats A” view in a future release. If that would change how you’d use the feature, let us know.
Ending a test
Section titled “Ending a test”Click End Test on the active card to stop the test. The results card on the Collections page transitions from green A/B active to grey A/B results, and the metrics detail remains accessible indefinitely.
There is no automatic “winner picker” — Dynasort doesn’t apply a winning recipe for you. After ending a test, decide which variant you want to run going forward and apply it manually. This is intentional: the statistical result is one input, but you may have business reasons (margin, inventory, brand fit) that override raw conversion lift.
Tips for a clean test
Section titled “Tips for a clean test”- Run on collections with traffic. A collection with 5 sessions a day will take weeks to cross the significance threshold. Pick collections that already see meaningful traffic.
- Don’t peek and stop early. Resist the urge to end a test the moment one variant looks ahead — early leads are usually noise. Wait for the Significant? column to flip to Yes, or for an honest amount of elapsed time to pass with enough data.
- One change at a time. If you’re testing Recipe A vs. Recipe B and the recipes differ in five attributes, you’ll know which recipe won, but not why. To learn what’s driving the lift, isolate one or two attributes per test.
- Watch out for seasonality. Tests started right before Black Friday or a sale event may capture buying patterns that don’t generalize. If possible, run during a representative window.
- End a test before changing the recipe. It’s preserved automatically, but it’s cleaner to do it deliberately.